Retention / Churn Analysis with SQL
Cohort retention is one of the most valuable tools in an analyst's toolbox. Here are a couple sample queries to get you started.
Most growth-minded product managers will tell you that retention is the most powerful force in a business's growth model. When users stick around they create value not just for a single transaction, but for their whole lifetime. High retention can justify expensive user acquisition tactics. Variance in retention across cohorts can be an indicator for opportunity to optimize.
Most analytics tools include retention visualizations to help an analyst understand if users are sticking around. Mixpanel includes a useful retention report that looks something like this.
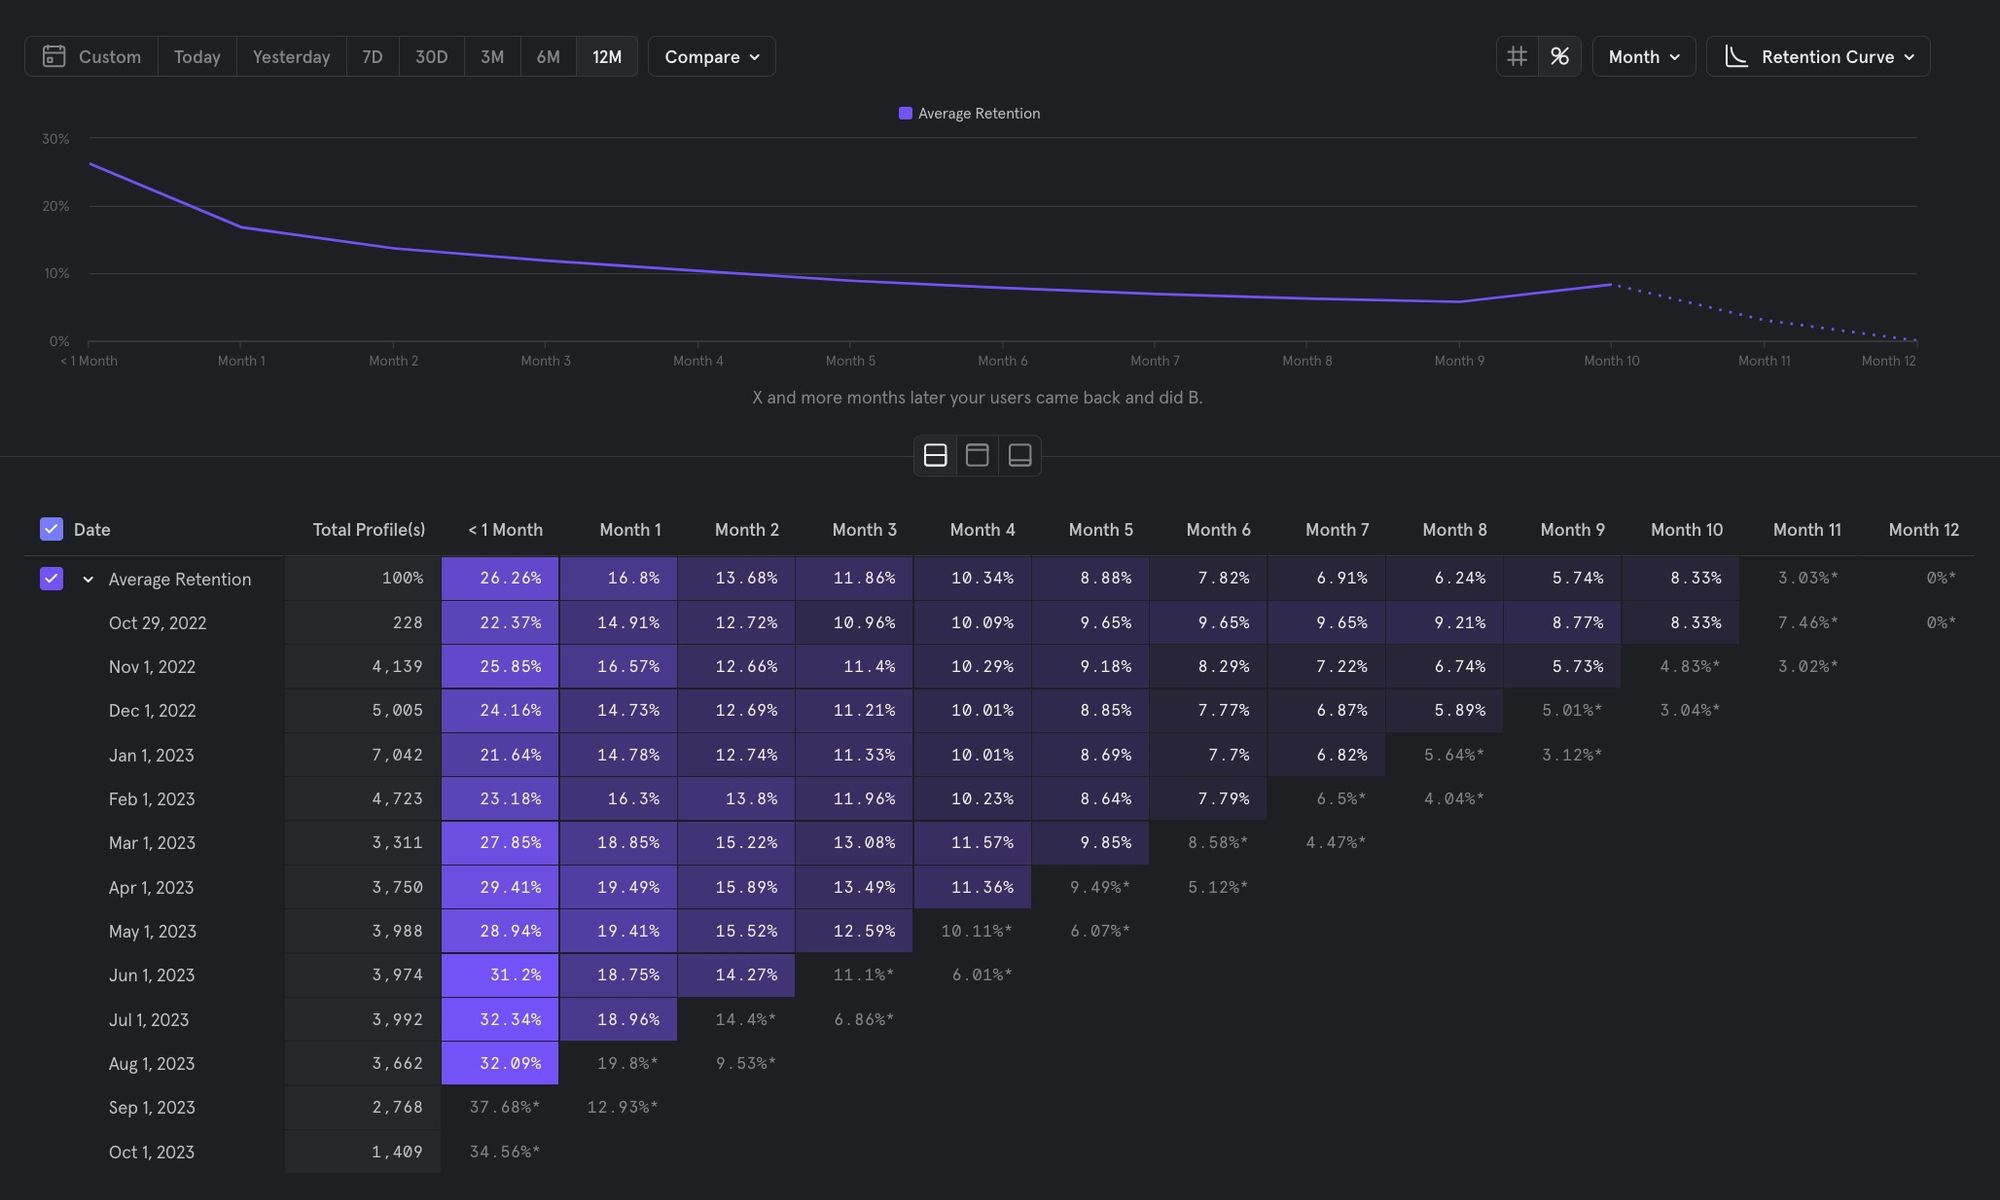
At the top you can see the average retention curve describing the product's overall stickiness for the average user acquired in the last 12 months. The table view shows monthly retention for every cohort. We can see that every month, 3,000 - 7,000 users are acquired, or enter a funnel for the first time. About 26% convert, or activate, within 1 month. In some months activation rate is higher than others, which can be a lagging indicator that we did something right and we should think about how to replicate that success in the future. After month 1, fewer and fewer users convert again.
Churn is a law of nature. All retention curves look something like what's shown above, but the most successful products flatline early after acquisition, keeping users retained at a high rate and increasing lifetime value.
Stack Overflow User Retention
We can reproduce this report with SQL. Here's an example using Stack Overflow answer data.
WITH by_year
AS (SELECT
  owner_user_id,
  DATE_TRUNC(creation_date, YEAR) AS answer_year
FROM `bigquery-public-data.stackoverflow.posts_answers`
),

first_year AS (
SELECT
  owner_user_id,
  answer_year,
  FIRST_VALUE(answer_year) OVER (PARTITION BY owner_user_id ORDER BY answer_year ASC) AS first_answer_year
FROM by_year
),

yr_number AS (
SELECT
  owner_user_id,
  answer_year,
  first_answer_year,
  DATE_DIFF(cast(answer_year as date), cast(first_answer_year as date), year) AS yr_num
FROM first_year),

data_a AS (
SELECT
  first_answer_year,
  COUNT(DISTINCT CASE WHEN yr_num = 0 THEN owner_user_id ELSE NULL END) as yr_0,
  COUNT(DISTINCT CASE WHEN yr_num = 1 THEN owner_user_id ELSE NULL END) as yr_1,
  COUNT(DISTINCT CASE WHEN yr_num = 2 THEN owner_user_id ELSE NULL END) as yr_2,
  COUNT(DISTINCT CASE WHEN yr_num = 3 THEN owner_user_id ELSE NULL END) as yr_3,
  COUNT(DISTINCT CASE WHEN yr_num = 4 THEN owner_user_id ELSE NULL END) as yr_4,
  COUNT(DISTINCT CASE WHEN yr_num = 5 THEN owner_user_id ELSE NULL END) as yr_5,
  COUNT(DISTINCT CASE WHEN yr_num = 6 THEN owner_user_id ELSE NULL END) as yr_6,
  COUNT(DISTINCT CASE WHEN yr_num = 7 THEN owner_user_id ELSE NULL END) as yr_7,
  COUNT(DISTINCT CASE WHEN yr_num = 8 THEN owner_user_id ELSE NULL END) as yr_8,
  COUNT(DISTINCT CASE WHEN yr_num = 9 THEN owner_user_id ELSE NULL END) as yr_9,
  COUNT(DISTINCT CASE WHEN yr_num = 10 THEN owner_user_id ELSE NULL END) as yr_10,
  COUNT(DISTINCT CASE WHEN yr_num = 11 THEN owner_user_id ELSE NULL END) as yr_11,
  COUNT(DISTINCT CASE WHEN yr_num = 12 THEN owner_user_id ELSE NULL END) as yr_12,
  COUNT(DISTINCT CASE WHEN yr_num = 13 THEN owner_user_id ELSE NULL END) as yr_13,
  COUNT(DISTINCT CASE WHEN yr_num = 14 THEN owner_user_id ELSE NULL END) as yr_14
FROM yr_number
GROUP BY 1
ORDER BY 1
)

select
  -- does NOT define cohort
  cast(first_answer_year as date) as year,
  -- does define cohort
  yr_0 as first_answer_year,
  round(yr_0 / yr_0, 2) yr_0_retention,
  round(yr_1 / yr_0, 2) yr_1_retention,
  round(yr_2 / yr_0, 2) yr_2_retention,
  round(yr_3 / yr_0, 2) yr_3_retention,
  round(yr_4 / yr_0, 2) yr_4_retention,
  round(yr_5 / yr_0, 2) yr_5_retention,
  round(yr_6 / yr_0, 2) yr_6_retention,
  round(yr_7 / yr_0, 2) yr_7_retention,
  round(yr_8 / yr_0, 2) yr_8_retention,
  round(yr_9 / yr_0, 2) yr_9_retention,
  round(yr_10 / yr_0, 2) yr_10_retention,
  round(yr_11 / yr_0, 2) yr_11_retention,
  round(yr_12 / yr_0, 2) yr_12_retention,
  round(yr_13 / yr_0, 2) yr_13_retention,
  round(yr_14 / yr_0, 2) yr_14_retention
from data_aThe cornerstone of any retention query is a log of events where we have a unique identifier for the user who did the event. In the example above we use the 14-year history of answers posted by Stack Overflow users as our event log. This dataset can be found in the table posts_answers. Here's some pseudocode that describes what the code above is up to:
1. Get all years where the user posted an answer
2. For each answer year, append the year where the user submitted their first answer
3. Use step 1 & 2 to determine interval since first answer
4. Get all first answer years, and count up users who continued to answer in subsequent years
5. Turn it into a percentage
When we run the code, we get a table of results that looks a lot like the table in the Mixpanel report. Here's that result exported into Sheets and styled a little bit.
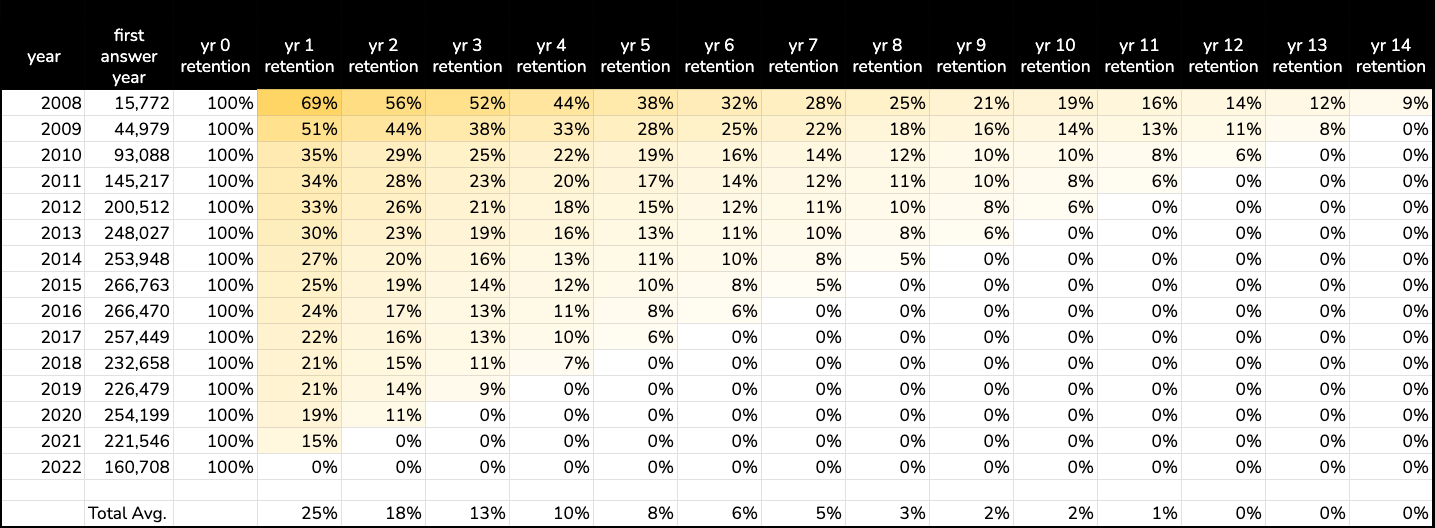
A retention table is worth a thousand words. A few observations...
- The data only goes up to 2022. But we see that new answerers seems to peak around 2015, and then again in 2020 (covid?)
- Year 1 retention has dropped steadily since Stack Overflow was founded. Fewer and fewer users are contributing answers after the first year when they contribute an answer.
- After 10 years on Stack Overflow, only about 1% of answerers continue to answer questions.
- In fact, 10-year answerer retention is much lower than this, but the number is inflated by the earliest cohorts of users. Nearly 10% of 2008 answerers continued to answer questions in 2022!
London Bike Share Lifespan
Let's generate another retention table, this time using London bike share data.
WITH by_year
AS (SELECT
  bike_id,
  DATE_TRUNC(start_date, year) AS ride_year
FROM `bigquery-public-data.london_bicycles.cycle_hire`
-- WHERE bike_model = 'PBSC_EBIKE'
),

first_year AS (
SELECT
  bike_id,
  ride_year,
  FIRST_VALUE(ride_year) OVER (PARTITION BY bike_id ORDER BY ride_year ASC) AS first_ride_year
FROM by_year
),

yr_number AS (
SELECT
  bike_id,
  ride_year,
  first_ride_year,
  DATE_DIFF(cast(ride_year as date), cast(first_ride_year as date), year) AS yr_num
FROM first_year),

data_a AS (
SELECT
  first_ride_year,
  COUNT(DISTINCT CASE WHEN yr_num = 0 THEN bike_id ELSE NULL END) as yr_0,
  COUNT(DISTINCT CASE WHEN yr_num = 1 THEN bike_id ELSE NULL END) as yr_1,
  COUNT(DISTINCT CASE WHEN yr_num = 2 THEN bike_id ELSE NULL END) as yr_2,
  COUNT(DISTINCT CASE WHEN yr_num = 3 THEN bike_id ELSE NULL END) as yr_3,
  COUNT(DISTINCT CASE WHEN yr_num = 4 THEN bike_id ELSE NULL END) as yr_4,
  COUNT(DISTINCT CASE WHEN yr_num = 5 THEN bike_id ELSE NULL END) as yr_5,
  COUNT(DISTINCT CASE WHEN yr_num = 6 THEN bike_id ELSE NULL END) as yr_6,
  COUNT(DISTINCT CASE WHEN yr_num = 7 THEN bike_id ELSE NULL END) as yr_7,
  COUNT(DISTINCT CASE WHEN yr_num = 8 THEN bike_id ELSE NULL END) as yr_8,
  COUNT(DISTINCT CASE WHEN yr_num = 9 THEN bike_id ELSE NULL END) as yr_9,
  COUNT(DISTINCT CASE WHEN yr_num = 10 THEN bike_id ELSE NULL END) as yr_10,
  COUNT(DISTINCT CASE WHEN yr_num = 11 THEN bike_id ELSE NULL END) as yr_11,
  COUNT(DISTINCT CASE WHEN yr_num = 12 THEN bike_id ELSE NULL END) as yr_12,
  COUNT(DISTINCT CASE WHEN yr_num = 13 THEN bike_id ELSE NULL END) as yr_13
FROM yr_number
GROUP BY 1
ORDER BY 1
)

select
  EXTRACT( year from first_ride_year) as year,
  yr_0 as first_ride_year,
  round(yr_0 / yr_0, 2) yr_0_retention,
  round(yr_1 / yr_0, 2) yr_1_retention,
  round(yr_2 / yr_0, 2) yr_2_retention,
  round(yr_3 / yr_0, 2) yr_3_retention,
  round(yr_4 / yr_0, 2) yr_4_retention,
  round(yr_5 / yr_0, 2) yr_5_retention,
  round(yr_6 / yr_0, 2) yr_6_retention,
  round(yr_7 / yr_0, 2) yr_7_retention,
  round(yr_8 / yr_0, 2) yr_8_retention,
  round(yr_9 / yr_0, 2) yr_9_retention,
  round(yr_10 / yr_0, 2) yr_10_retention,
  round(yr_11 / yr_0, 2) yr_11_retention,
  round(yr_12 / yr_0, 2) yr_12_retention,
  round(yr_13 / yr_0, 2) yr_13_retention
from data_aThis is basically the same code that was shared in the first example, but we're using a different data set: bigquery-public-data.london_bicycles.cycle_hire.
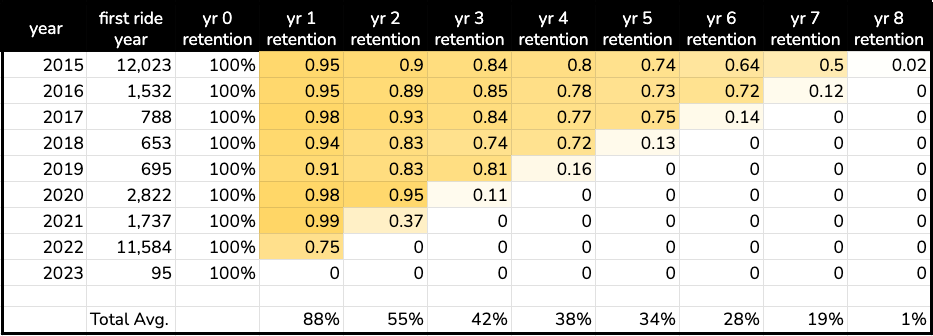
Here we see that by year 4 about 20% of bikes churn out of the system. And in 2022, a lot more bikes were added to the system – many of them are ebikes, which you can explore through the data.
This is just a tease of the things you can do with SQL to analyze retention and churn. These queries can be extended to analyze retention across segments, eg. regular bikes vs. ebikes, or to identify activities that correlate with increased lifetime value. (Do answerers stick around longer if one of their first answers was accepted? Yes.) No matter what data you're working on, retention analysis will come in handy.
Did you learn something from this post? See an error or have an observation? Leave a comment!
Other posts in this series:


