Case Study: Clipboard Health Lyft Pricing Exercise
Here is my answer to the Clipboard Health product case study. I didn't get the job.

Clipboard Health is a Y-combinator funded startup building a platform to match medical professionals to healthcare facilities. Sounds like a cool company! They're hiring.
Good news: If you apply for a job at Clipboard Health, you'll probably get a response.
Bad news: You'll be asked to complete a lengthy case study. You're almost guaranteed to fail. And you'll receive zero feedback.
I probably should have listened to the hundreds of negative reviews on Glassdoor. But I didn't. I got nerd sniped and I spent several hours completing the case study. I've published my work below to help others solve the case study faster, and because I have no idea how I failed. Do you see my mistake? If so, let me know!
The Challenge
SUMMARY
Identify the optimal take rate (how much Lyft makes per ride) to maximize net revenue (the difference between amount riders pay and the amount Lyft pays to drivers) for the next 12 months on a given route in Toledo.
BACKGROUND
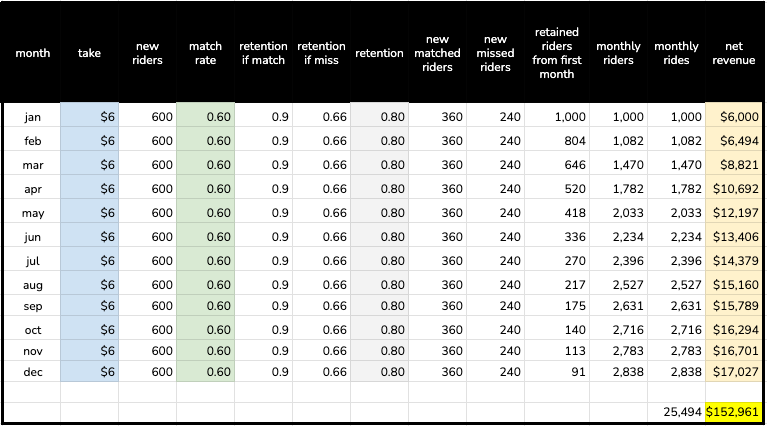
We are told that current price for the route is $25 and take is $6, so drivers currently earn $19 per trip, which results in a 60% match rate – 60 out of 100 riders find a ride at this rate.
And when we run a pricing experiment reducing Lyft's take from $6 to $3, we see that match rate rises from 60% to 93%. In other words, as Lyft takes less, drivers earn more, and they're more likely to accept a ride.
We are given additional information to help us build a model. The most important is churn. Riders who don't fail to find a driver churn at 10% monthly, while riders who do fail to find a driver churn at 33%. I like to think positively, so I will use retention instead of churn.
We're given other inputs as well, such as CAC for both drivers and riders, but this information shouldn't be required to produce a result given that net revenue, as defined in the exercise, is independent of cost of acquisition. So we should be able to ignore CAC for now.
My Result
Is this wrong? It might be! Let me know what you think by leaving a comment or finding me on LinkedIn.
THE RESULT
The optimal take rate for the business is $4 to $5 per ride.
HOW I DID IT
First, we build a model from the two pricing experiments, and then we use that model to project retention (churn), and total rides in 12 months, which we can multiply by our take rate to calculate net revenue.
First, let's look at what a whole year might look like under the current $6 take rate...
We can do the same for the $3 experiment, where match rate increases to .93, shifting retention up to .88.
From this, we can build a simple linear model to project match rate for all $1 increments.
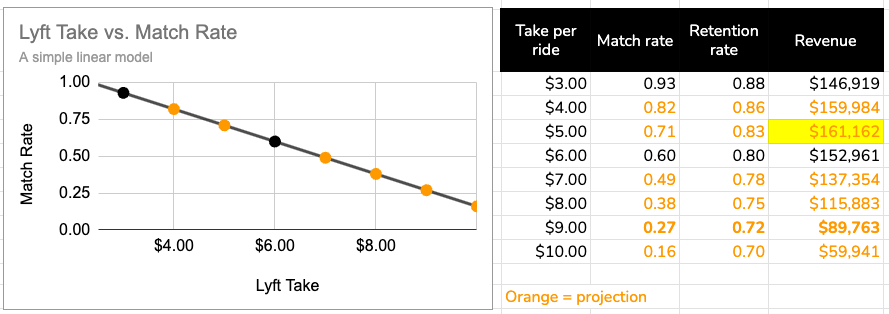
We see that for every extra dollar that we take from drivers, our match rate drops by 11 percentage points (our slope).
Match rate is the determining factor for rider retention, and we see that retention drops 2-3 percentage points as match rate drops at every extra dollar we take.
At $5, our net revenue peaks, and then it starts to drop as rider churn outweighs the money that’s coming in per ride.
Double check the work
Let's double check the result we arrived at above by adding another layer to our model: market penetration.
It stands to reason that there will be diminishing returns the longer we are in market. So let's cut new riders by about 10% for every subsequent monthly cohort and see how this changes the result.
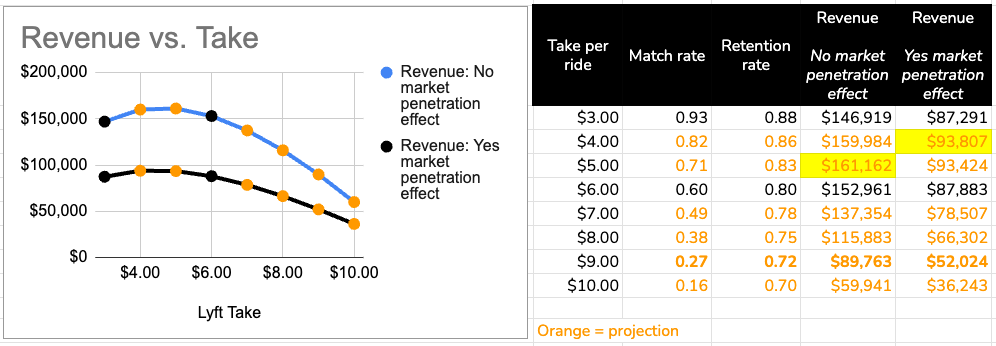
With this new model revenue peaks at $4. So it is fair to say that the optimal take rate for the business is between $4 and $5.
Caveats apply
This is a super simplified linear model to project match rate. In fact, match rate might drop off a lot more steeply once we get past a $6 take rate, which would result in an optimal take rate closer to $6.
That's it!
Nope, that's not it.
The morning after submitting my response I received a generic rejection letter from the hiring team. I asked for feedback, and did not receive any. I am clearly not alone.
What do you think? How did I do?
Other articles on this website:
 Sam Brand
 Sam Brand
 Sam Brand